01 / 09 RIGHT NOW
◉
Current conditions
Know what it's like outside right now.
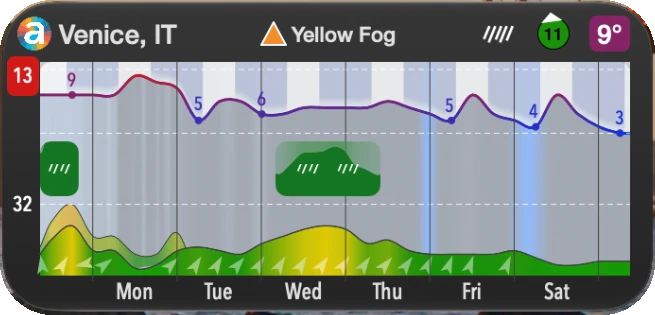
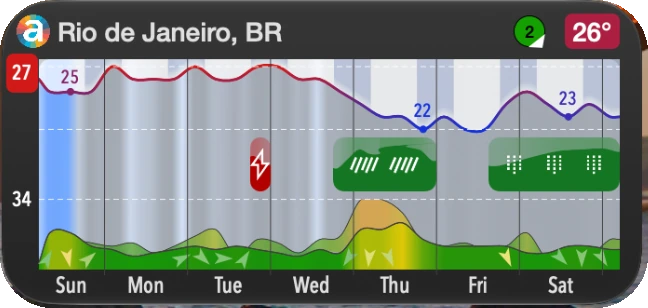
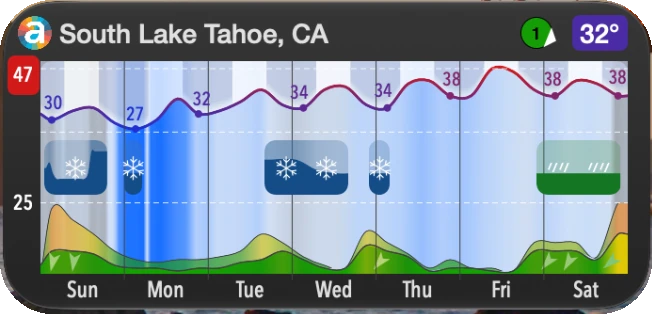
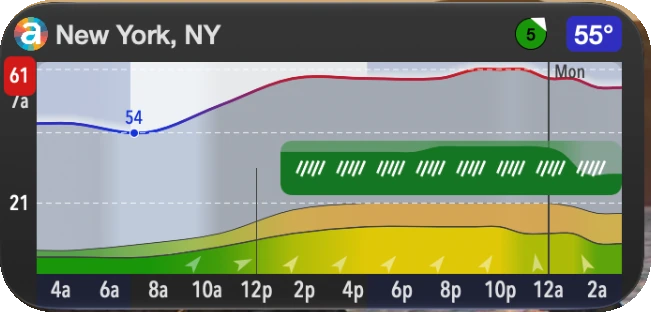
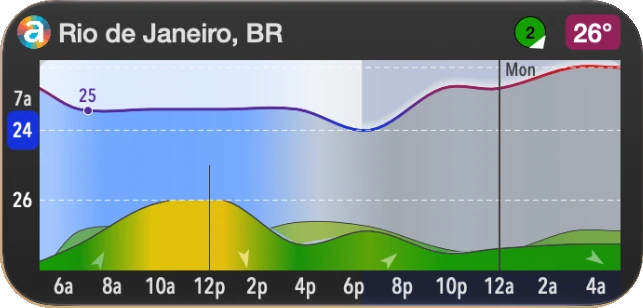
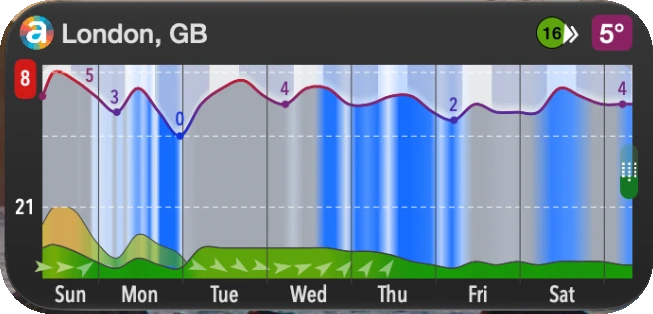
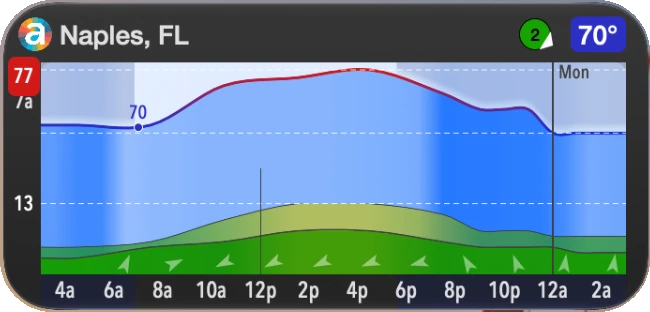
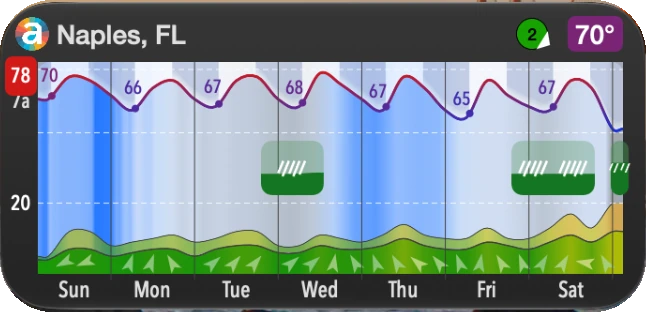
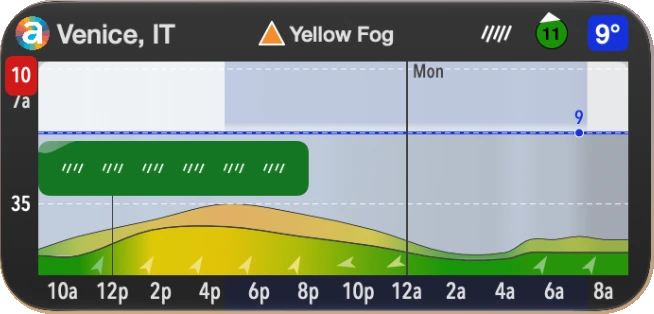
The two compact badges in the upper-right corner give you an immediate read on current conditions, including temperature and wind, without opening a separate forecast.
Right now, at a glance.
02 / 09 TEMPERATURE
⌁
Temperature line
See the warming and cooling pattern.
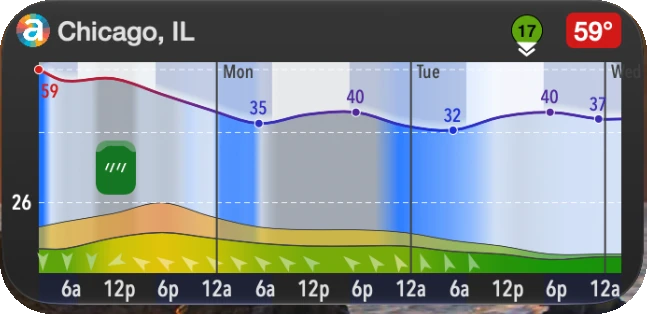
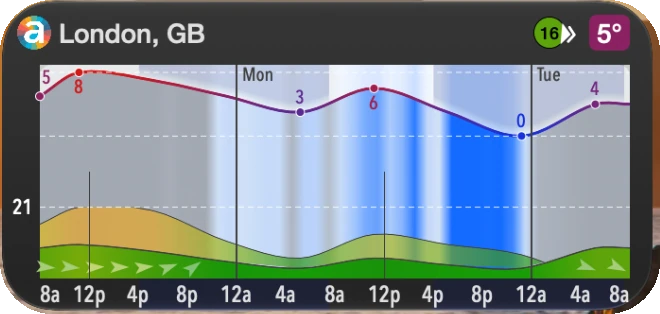
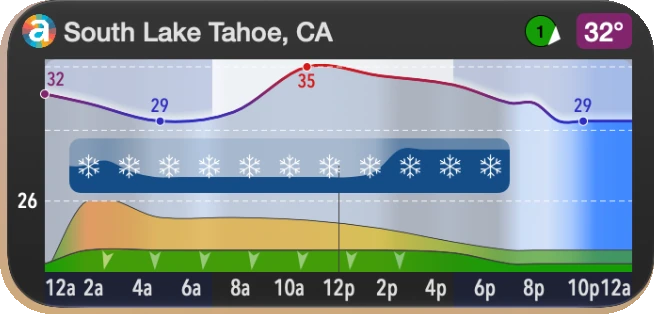
A continuous curve traces temperatures across the forecast. The labeled points help you spot changes quickly rather than reading a separate hourly list.
Watch the line, see the trend.
03 / 09 TEMPERATURE RANGE
↕
Highs & lows
Spot the temperature range immediately.
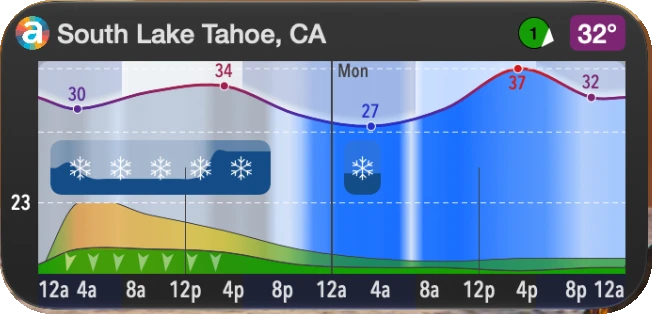
Prominent values along the left edge show the range of forecast temperatures, while labels on the curve make it easy to find the warmer and colder stretches.
More context than a single number.
04 / 09 THE ATMOSPHERE DIFFERENCE
◐
Sky Color Forecast
The sky isn't four icons. It's a spectrum.
Atmosphere uses 100 sky-color values, moving from gloomy overcast gray to brilliant blue. You can see when the clouds break, where the clearer periods fall, and remember those stretches of sunshine.
Remember the blue, not an icon.
05 / 09 SKY COLOR
☁
Gray sky
See cloudier periods without decoding icons.
Gray areas in the background represent more overcast conditions. Their position on the timeline shows when the sky is expected to look gloomier.
Gray means cloudier skies.
06 / 09 SKY COLOR
☀
Blue sky
Know when the sunshine is coming.
The richer blue around Tuesday shows a brighter, clearer stretch of the forecast. Compared with repeated partly sunny icons, this makes it much easier to see and remember when the sun is expected.
Spot the sunshine before you look outside.
07 / 09 WIND DIRECTION
➤
Wind direction
Follow the direction of the wind.
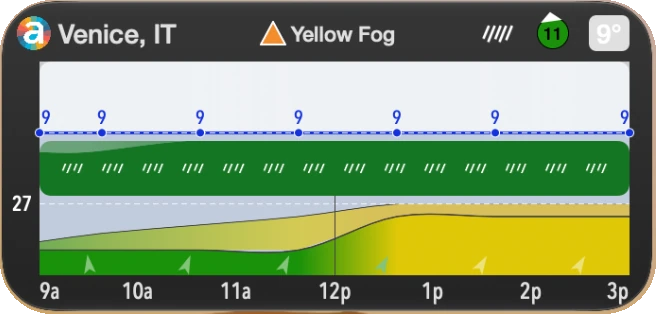
The small arrows along the bottom show forecast wind direction at different times. See how the wind shifts without switching to another chart.
The arrows show direction, not rainfall.
08 / 09 WIND SPEED
▥
Sustained wind graph
See how strong the wind will be.
The rolling colored band at the bottom shows sustained wind speed through time. Green reflects lighter wind; higher yellow and orange areas reveal stronger periods.
Speed in the band. Direction in the arrows.
09 / 09 PRECIPITATION
☂
Precipitation forecast
See when rain or snow is expected.
Green forecast blocks with rain marks sit in the middle of the widget. Their placement and length help show the expected timing and duration of precipitation, independent of the wind arrows below.
Rain and snow have their own forecast layer.